Cloud cost optimization
Stop wasting money in the cloud: A smarter approach to cloud cost optimization
A significant portion of all cloud spend is wasted on idle or over-provisioned resources—a problem that only grows with multi-cloud complexity. Going beyond simple visibility, Flexera Cloud Cost Optimization solutions provide automated recommendations and policy-based actions to help you eliminate waste, maximize the value of your commitments and dramatically reduce your cloud bill.
Recommended Products
Improve visibility and efficiency of cloud spend at scale
Allocate cloud costs
Improve visibility and allocation of cloud spend
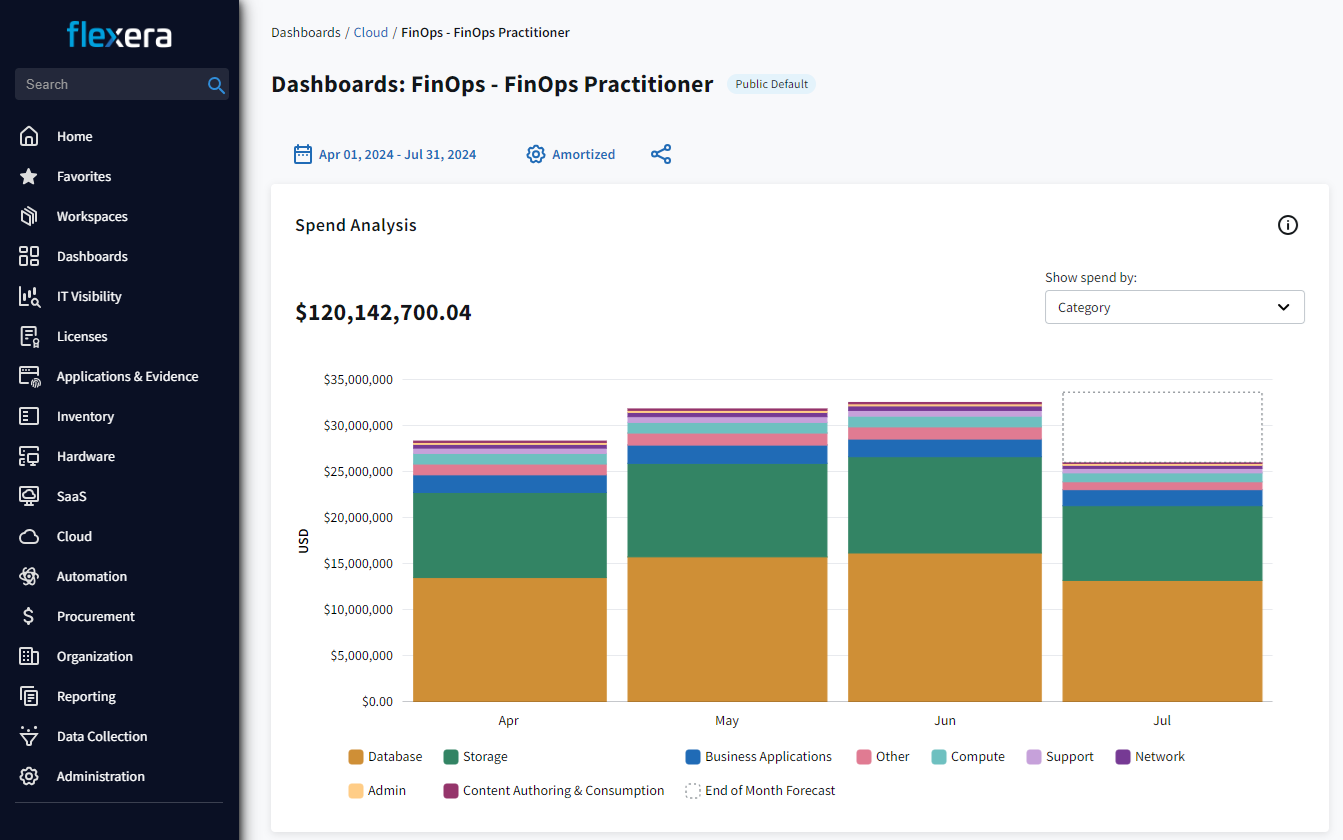
Monitor your cloud usage allocation, costs and discounting structures for all public and private cloud accounts and all associated costs—allowing you to identify cloud cost optimization and savings opportunities and receive smart recommendations for cost optimization actions.
Reduce wasted cloud spend
Improve efficiency of cloud spend
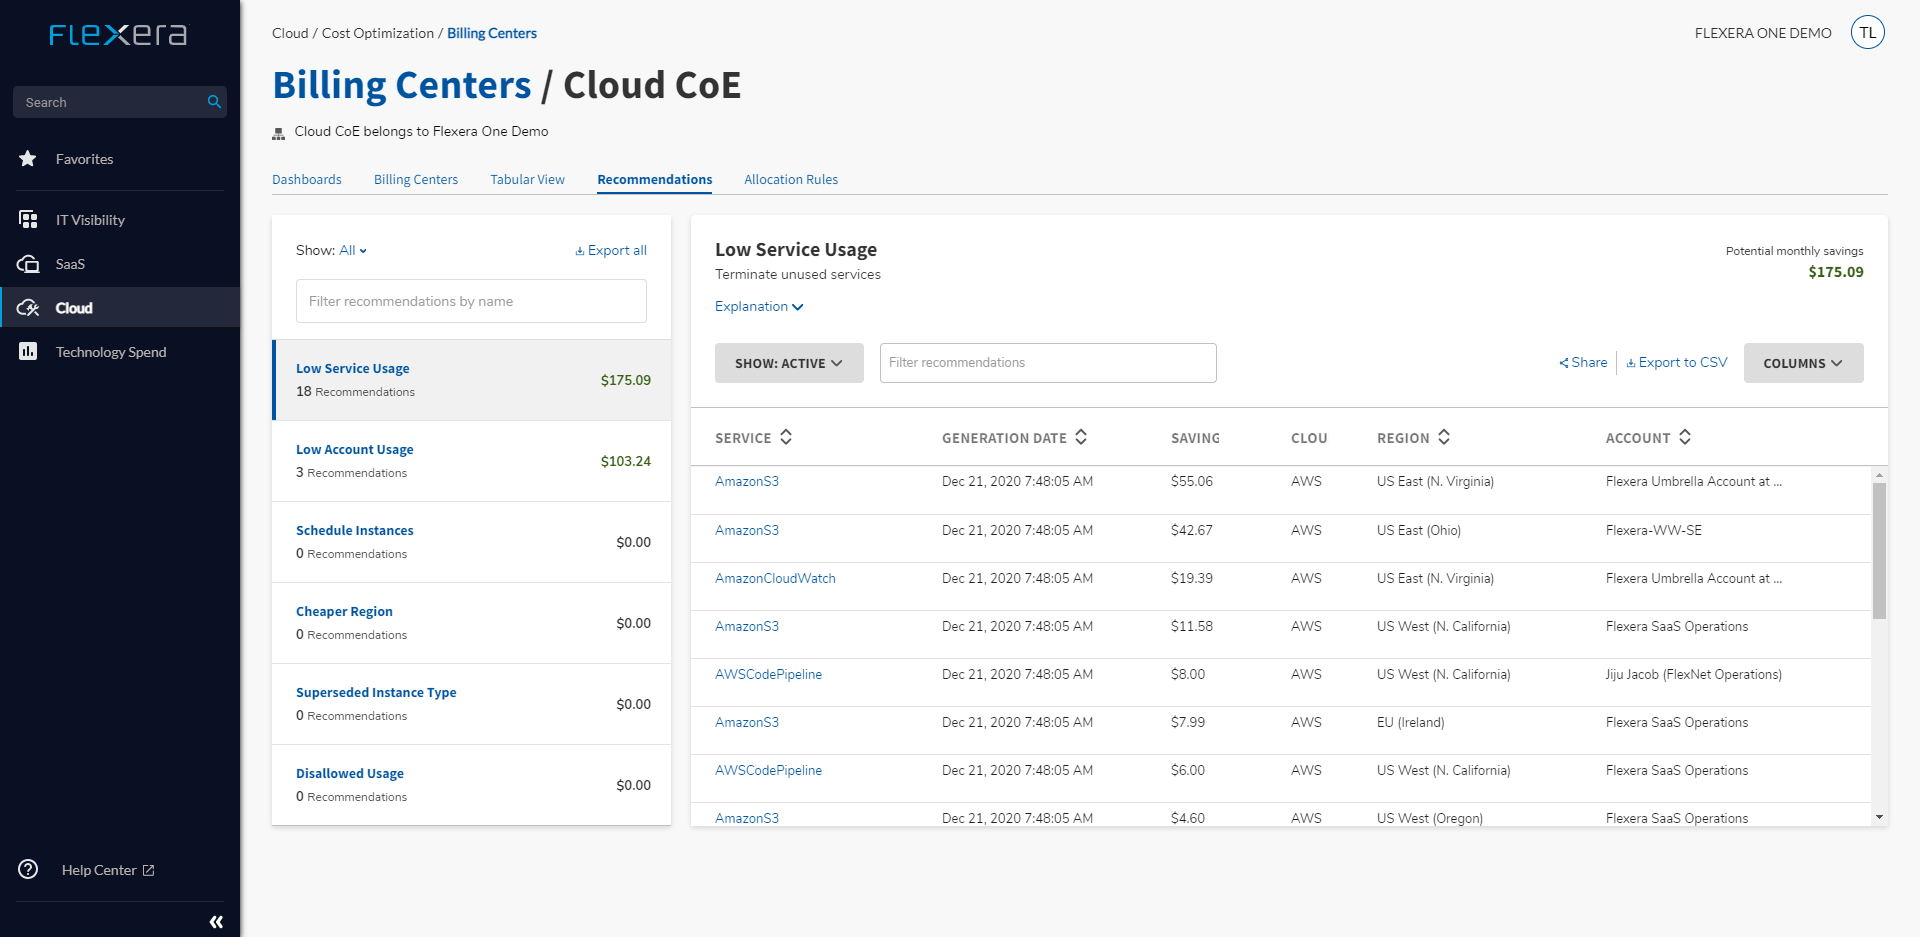
Actionable cloud spend recommendations help your organization continuously identify and act on non-optimized resources.
Operate cloud at scale
Detect spend anomalies and implement budget controls
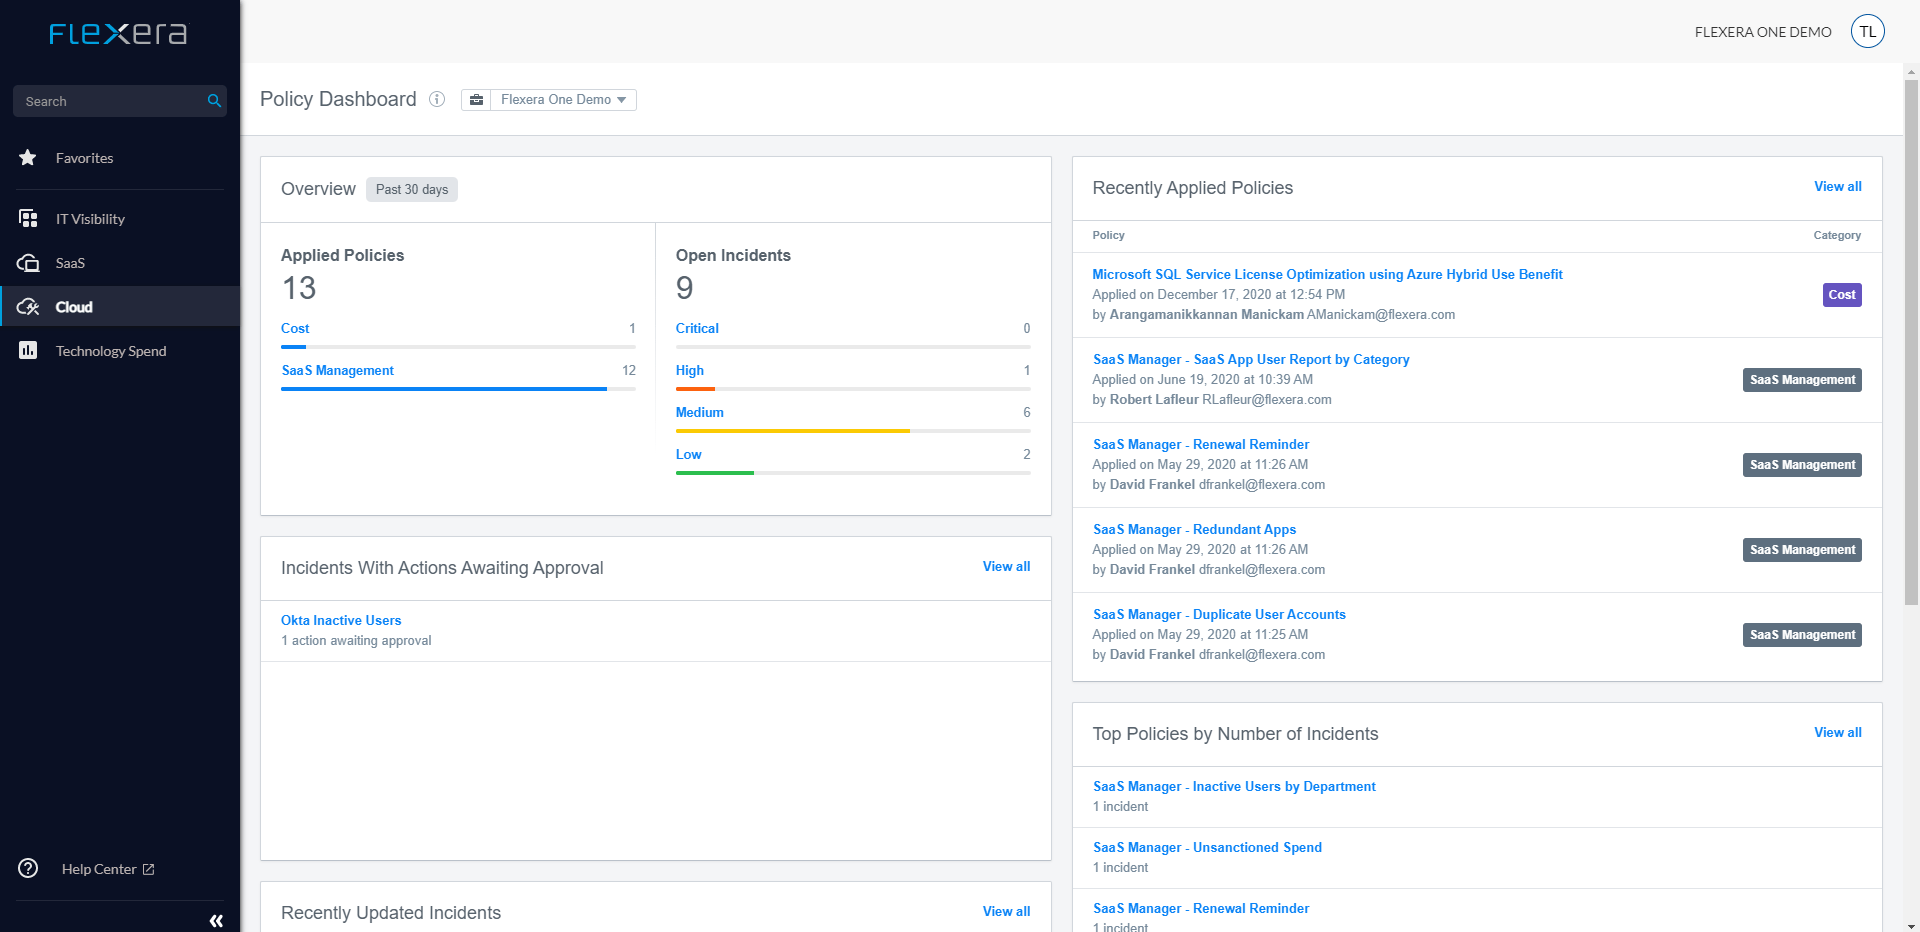
Reporting on spending anomalies paired with budget controls and cost policies helps your organization avoid surprises and eliminate waste. Powerful functionality enables cloud governance teams to collaborate with business units and cloud resource owners to report, manage and optimize cloud spend.

Cut carbon emissions and costs
Drive smarter FinOps with auditable cloud sustainability
Get visibility at the intersection of multi-cloud usage, cost, and carbon emissions (CO2e). Cut resource waste to lower both CO2e and costs with ISO-14064 certified data for GHG Protocol reporting from Flexera partner Greenpixie. Enable green software development and operations at scale with policy-driven automation.
Cloud budget
Where your cloud budget is really going
Identifying optimization opportunities in a dynamic multi-cloud environment is a significant challenge for even the most mature organizations. The complexity of managing provider-specific pricing discount instruments and ever-changing resource needs makes it nearly impossible to manually track and eliminate waste.
- Idle resources: Paying for virtual machines, storage volumes, snapshots and other resources that are not being used
- Over-provisioned resources: Using larger-than-necessary instances that could be scaled down and right-sized without impacting performance
- Suboptimal discount management: Underutilizing commitment-based discounts like AWS Savings Plans and Reserved Instances (RIs) or Azure Hybrid Benefit
- Inefficient scheduling: Running non-production resources 24/7 when they are only needed during business hours
- Orphaned resources: Spending on storage volumes and snapshots left behind after a virtual machine has been terminated
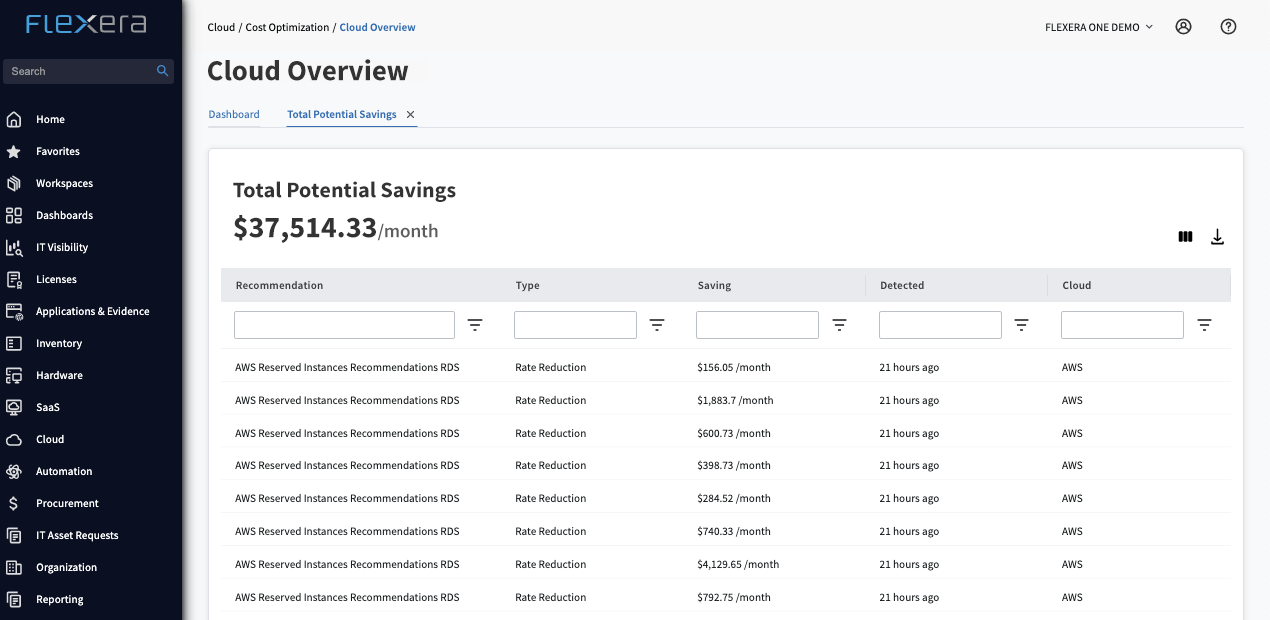
- Rate optimization: We provide recommendations to maximize your savings from commitment-based discount programs like AWS Savings Plans, RIs, Azure Hybrid Benefit and Google Committed Use Discounts
- Usage optimization: Our platform continuously identifies idle and underutilized resources, suggesting actions like terminating "zombie" infrastructure and rightsizing oversized instances to reduce consumption
- Automated policy engine: We enable you to implement automated policies that take action on savings recommendations, ensuring opportunities are never missed
- Unified multi-cloud view: Analyze and optimize costs across AWS, Azure, Google Cloud and your entire hybrid IT estate from a single platform
Maximizing cloud savings
A twofold approach to maximizing cloud savings
Flexera provides comprehensive capabilities to attack cloud waste from two primary angles: reducing the rates you pay for cloud services and optimizing the resources you consume. This dual approach ensures you achieve the deepest possible savings.
Your cloud Bill
Actionable strategies to reduce your cloud bill
Effective cloud cost optimization involves a continuous cycle of analysis and action. Flexera supports all the core strategies needed to build a successful optimization practice.
- Rightsizing: Analyze performance metrics to downsize over-provisioned instances to the most cost-efficient size
- Terminating idle and unused resources: Automatically identify and decommission resources that are no longer providing value
- Managing discount commitments: Get recommendations on buying, selling or modifying reserved instances and savings plans to maximize ROI
- Scheduling workloads: Automate the process of turning off non-production resources during evenings and weekends
- Optimizing storage: Identify and delete unattached storage volumes and old snapshots to reclaim capacity
- Fund innovation: Redirect saved cloud spend toward strategic initiatives that drive business growth
- Improve profitability: Lower the cost of goods sold (COGS) for your cloud-based products and services
- Foster a cost-conscious culture: Empower engineering teams with the data they need to make cost-aware decisions without slowing down development
- Enhance financial predictability: Create more accurate cloud budgets and forecasts by eliminating waste and volatility
- Drive sustainability goals: Reduce resource consumption to lower both your cloud bill and your carbon footprint
Fuel innovation
Reinvesting savings to fuel innovation
Cloud cost optimization is not just about cutting the IT budget. It's a strategic enabler that frees up capital and resources to be reinvested in innovation, driving new projects and creating a competitive advantage for your business.
What's weighing down your cloud?
84%
budget bloats
77%
security slip-ups
75%
resource bottleneck
The Flexera difference
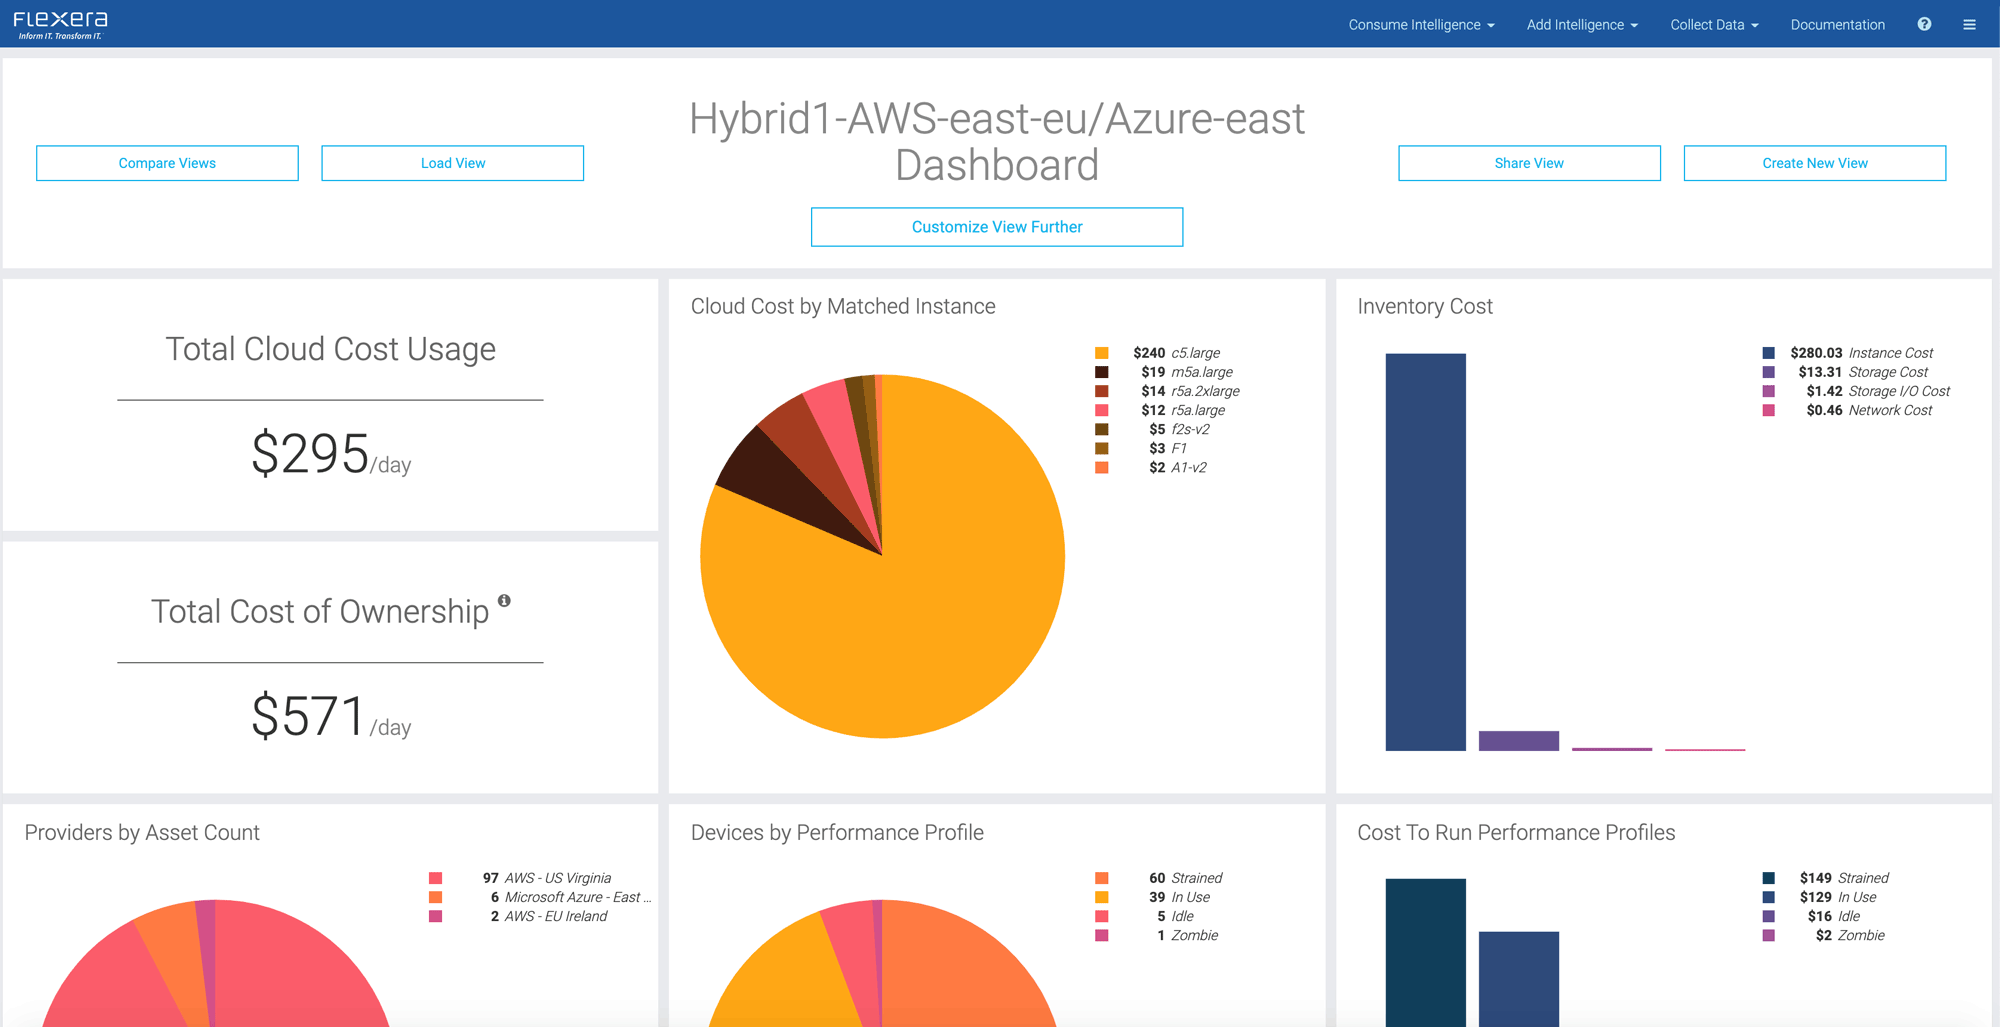
Comprehensive view of your cloud spend
Flexera One supports your organization’s FinOps journey and enables cloud governance and FinOps teams to work collaboratively with business units, ITAM teams and cloud resource owners to gain visibility and identify areas of savings. With Flexera One, you get a comprehensive set of cloud cost optimization capabilities designed to implement FinOps processes across your entire cloud environment.
The Flexera and Snow advantage
Automation and a unified view
Recognized as a leader by Forrester in Cloud Cost Management and Optimization, Flexera provides a powerful policy-based engine for automating savings and a unique ability to see cloud costs in the context of your entire hybrid IT portfolio.
Powerful automation engine |
Comprehensive hybrid visibility |
|---|---|
| Leverage over 90 out-of-the-box cost optimization policies or create your own to automate action on savings recommendations (Refers to current page FAQ) | Analyze cloud costs alongside on-premises software, SaaS and licensing costs for a true understanding of your technology TCO |
| Collaborate with business units and resource owners to manage and optimize spend without manual intervention | Make informed decisions about workload placement and cloud migration with a complete view of your estate |
Choose Flexera to move beyond simple reporting and start automating real savings across your multi-cloud environment.
Real-world savings with Flexera
Flexera allowed us to diagnose and save $200,000 per year across three cloud vendors without disrupting operations.
Your cloud cost optimization questions answered
Frequently asked questions
Flexera’s cloud cost optimization solution addresses all phases of the FinOps Foundation framework and provides support for all aspects of your organization’s cloud optimization journey. Full visibility into all cloud costs are provided, and additional related non-cloud costs can be ingested to provide a true TCO for your cloud applications and workloads.
Flexera analyzes your detailed billing and usage data and applies a library of over 90 policies to identify specific savings opportunities such as idle instances that can be deleted or commitment discounts that can be purchased.
Flexera provides deep cost optimization capabilities for the major cloud providers including AWS, Azure and Google Cloud.
Cloud cost management involves visibility reporting and budget allocation (knowing what you're spending). Cloud cost optimization is the practice of actively taking steps to reduce that spend (saving money) through actions like rightsizing and terminating idle resources.
Yes, Flexera’s policy engine can be configured to automatically take action on recommendations such as terminating resources after an approval workflow. This enables optimization at scale.
Rightsizing involves analyzing the actual performance utilization (like CPU and memory) of a cloud instance over time to determine if it is over-provisioned. Flexera then recommends a smaller, more cost-effective instance type that can handle the workload without impacting performance.
Master cloud cost optimization with expert insights
Informing IT, Transforming IT
Ready to eliminate wasted cloud spend?
Start your journey from cost visibility to automated optimization. Talk to our team to get a personalized demo of our cloud cost optimization capabilities.